
Gamma 101
📌 Overview
When working with digital images, gamma correction is a non-linear operation used to control how brightness levels are mapped between input and output.
Its relevance derives from the fact that human vision is non-linear:
We’re extremely sensitive to differences in dark regions
We’re much less sensitive to changes in bright regions
Why gamma correction is non-linear
If brightness were mapped linearly:
Midtones would look too dark
Much of the bit depth would be wasted on bright values our eyes barely distinguish
With gamma encoding:
More precision is spent in darker regions where we’re sensitive
The distribution of pixel values better matches what we perceive
When you adjust gamma manually:
Lowering gamma (<1) lightens shadows because our eyes are more sensitive there
Raising gamma (>1) darkens shadows without making highlights look “crushed”
This is why gamma is a standard way to brighten/darken digitally—it aligns with human vision rather than simple linear scaling.
ℹ️ Understanding gamma correction
Gamma correction typically uses a function of the form:
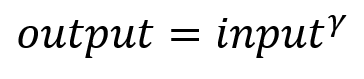
Where:
input is a normalized pixel value (0.0 → 1.0)
γ ("gamma") controls how brightness is redistributed
Gamma correction works because the human eye perceives brightness non-linearly, and many digital images are stored in a gamma-encoded space to look visually correct.
What Gamma Does Visually
Gamma > 1 → Darkens the image
Example: γ = 2
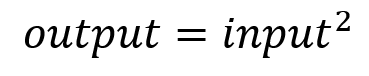
Dark areas get much darker; bright areas change less.
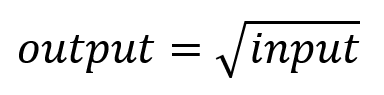
Gamma < 1 → Lightens the image
Example: γ = 0.5
Gamma = 1 → No change
For γ = 1:
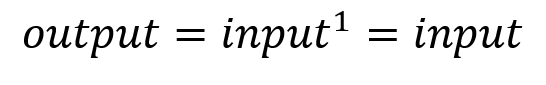
Gamma = 1 is the identity transform.
Visual Effect
γ > 1 | Non-linear darkening | Deepens shadows |
0 < γ < 1 | Non-linear lightening | Lifts shadows |
γ = 1 | Identity transform | No change |
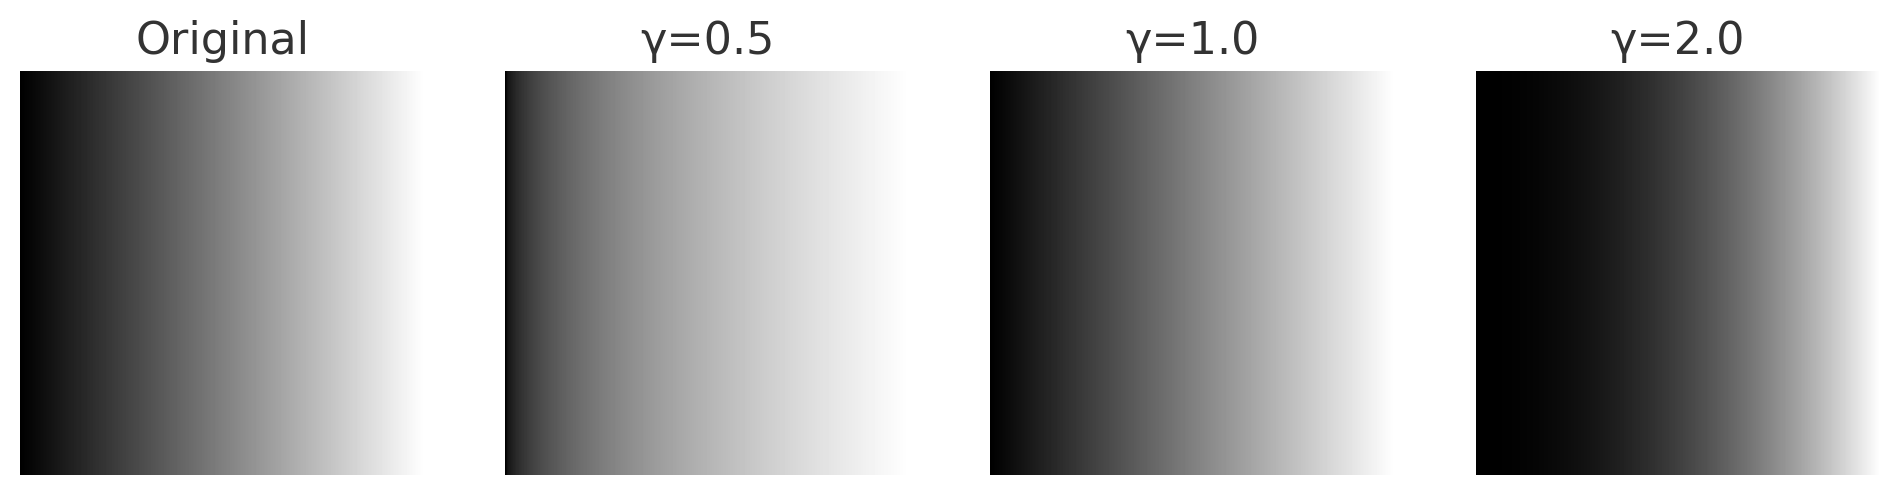
Effect on a linear gradient
Chart
The full range of values can be seen on this chart.
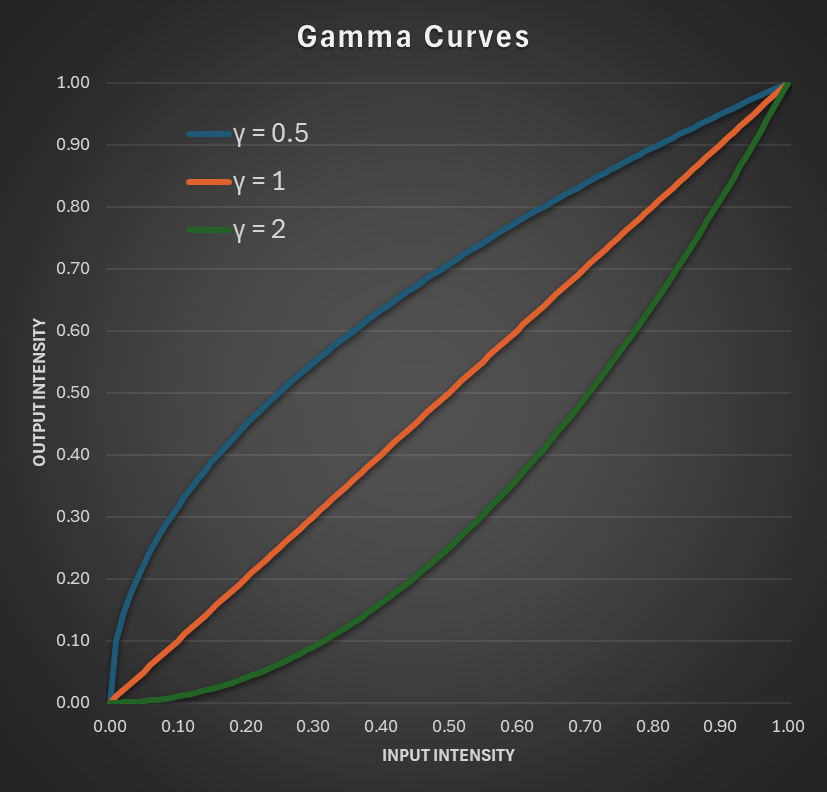
Gamma curves
📚 Additional Resources
A worked example using Apex' tone curves feature can be found here.