(v13) Bump-up curves
This page applies to Harlequin v13.1r0 and later; both Harlequin Core and Harlequin MultiRIP.
The array contains a number of (X,Y) pairs each representing a point on the /BumpUpCurve. The following conditions must be met (which are slightly different to those for a normal calibration curve represented by the /Curve entry in a colorant sub-dictionary):
- the array must contain at least
2number pairs. - the X values must exactly cover the range
0.0to1.0, that is, the first number in the array must be0.0and the 2nd last must be1.0. - both X and Y values must be at least weakly monotonic, that is, a duplicate X or Y value is allowed (to represent a vertical or horizontal curve section), but an X value may not be lower than an X value earlier in the array and a Y value may not be lower than a Y value earlier in the array.
The RIP connects the points using straight lines. The purpose of this parameter is to allow adjustment of the highlight values in flexographic printing. One /BumpUpCurve is used for all color channels.
Unlike a normal calibration curve for which the RIP may slightly smooth the values for performance reasons, with a /BumpUpCurve the RIP preserves sharp changes in output value (see Example bump-up curve arrays below for more information on bump-up curves).
If present, the /BumpUpCurve is applied to each colorant channel after the appropriate colorant /Curve has been applied. See also (v13) Order of application of calibration and transfer functions .
When printing a calibration strip, it may be advisable to omit /BumpUpCurve from the calibration dictionary. The HMR RIP automatically omits /BumpUpCurve in this case, and the same is true for HHR when used via the PushCalibration interface.
To get more accurate results with shaded fills, it may be found necessary to increase the settings for the /GouraudLinearity and /BlendLinearity user parameters from the default values; for example:
            <<
            /GouraudLinearity 4
            /BlendLinearity 3
            >> setuserparams
Example bump-up curve arrays
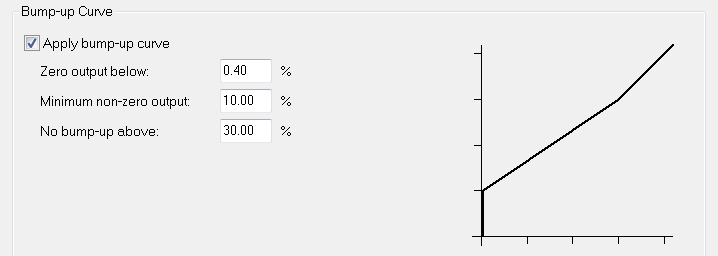
A bump-up curve which gives zero output below 0.4%, a minimum non-zero output of 10% and is linear from 30% is defined thus:
/BumpUpCurve [0.0 0.0 0.7 0.7 0.996 0.9 0.996 1.0 1.0 1.0 ]
This same example in the Harlequin MultiRIP would appear as:

The 0.0 end of the array represents dark values, and the 1.0 end of the array represents highlights.
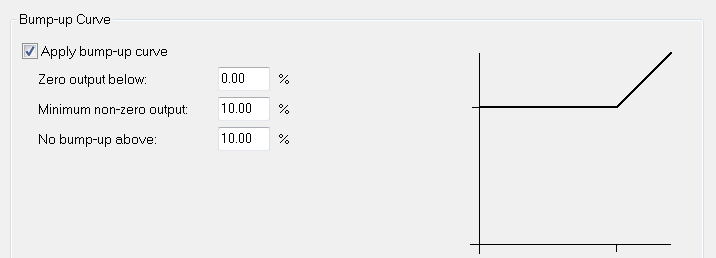
A bump-up curve that gives 10% output for any input value below 10%, and is linear above 10%, is defined thus:
/BumpUpCurve [0.0 0.0 0.9 0.9 1.0 0.9 ]
This same example in the Harlequin MultiRIP would appear as:

