Dot Gain Correction
The purpose of the dot gain correction stage is to measure the density response of the printer and to build a density correction curve.
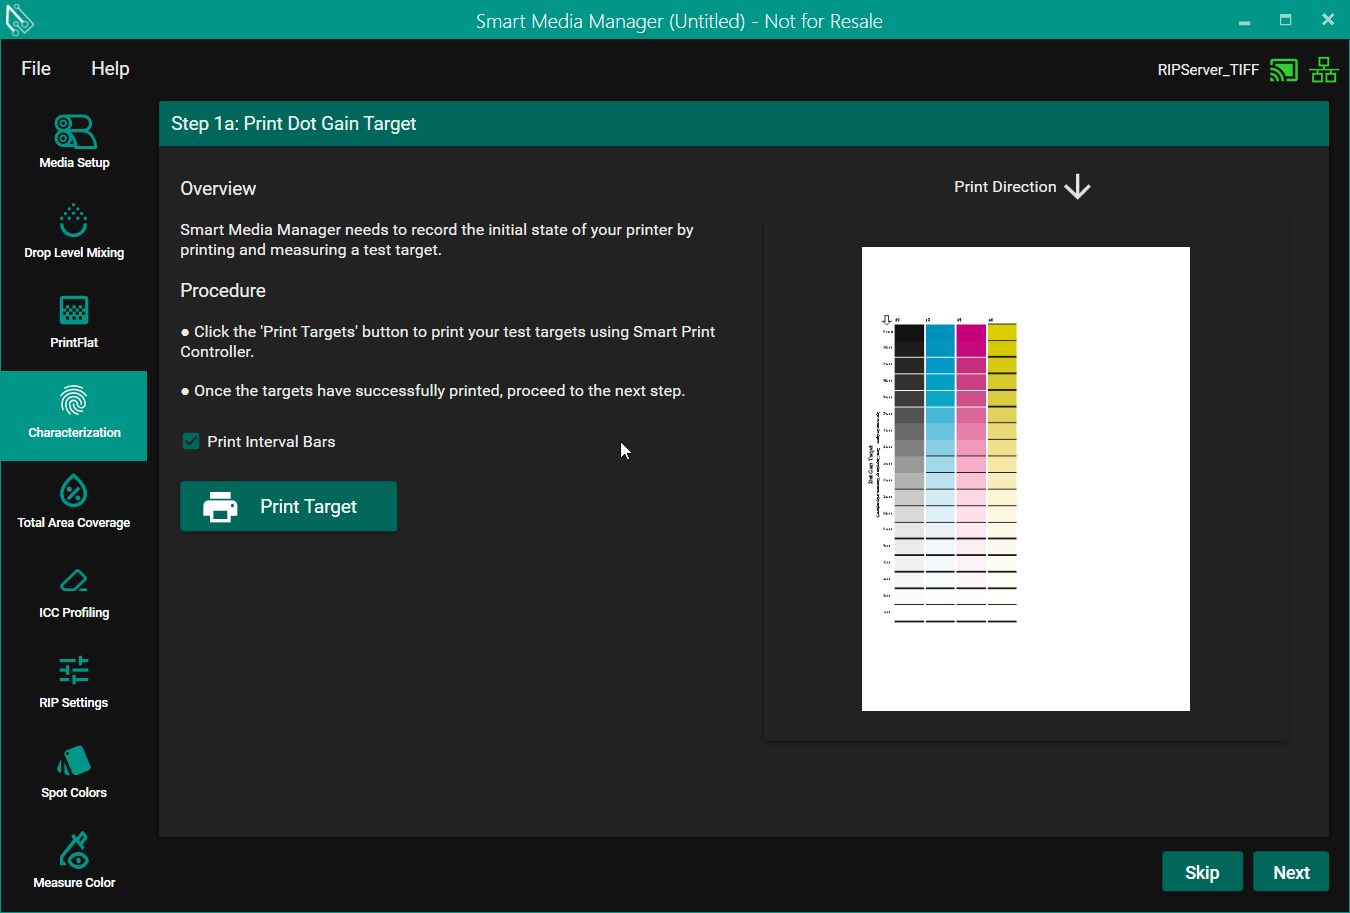
Step 1a: Print Dot Gain Target

Print Interval Bars - A toggle switch to activate or deactivate the printing of interval bars on the test chart.
Choose PRINT TARGET to print the target previewed to the right on Smart Print Controller (SPC).
If you do not wish to print targets, choose Skip, which gives you the option to use measurements you have taken previously.
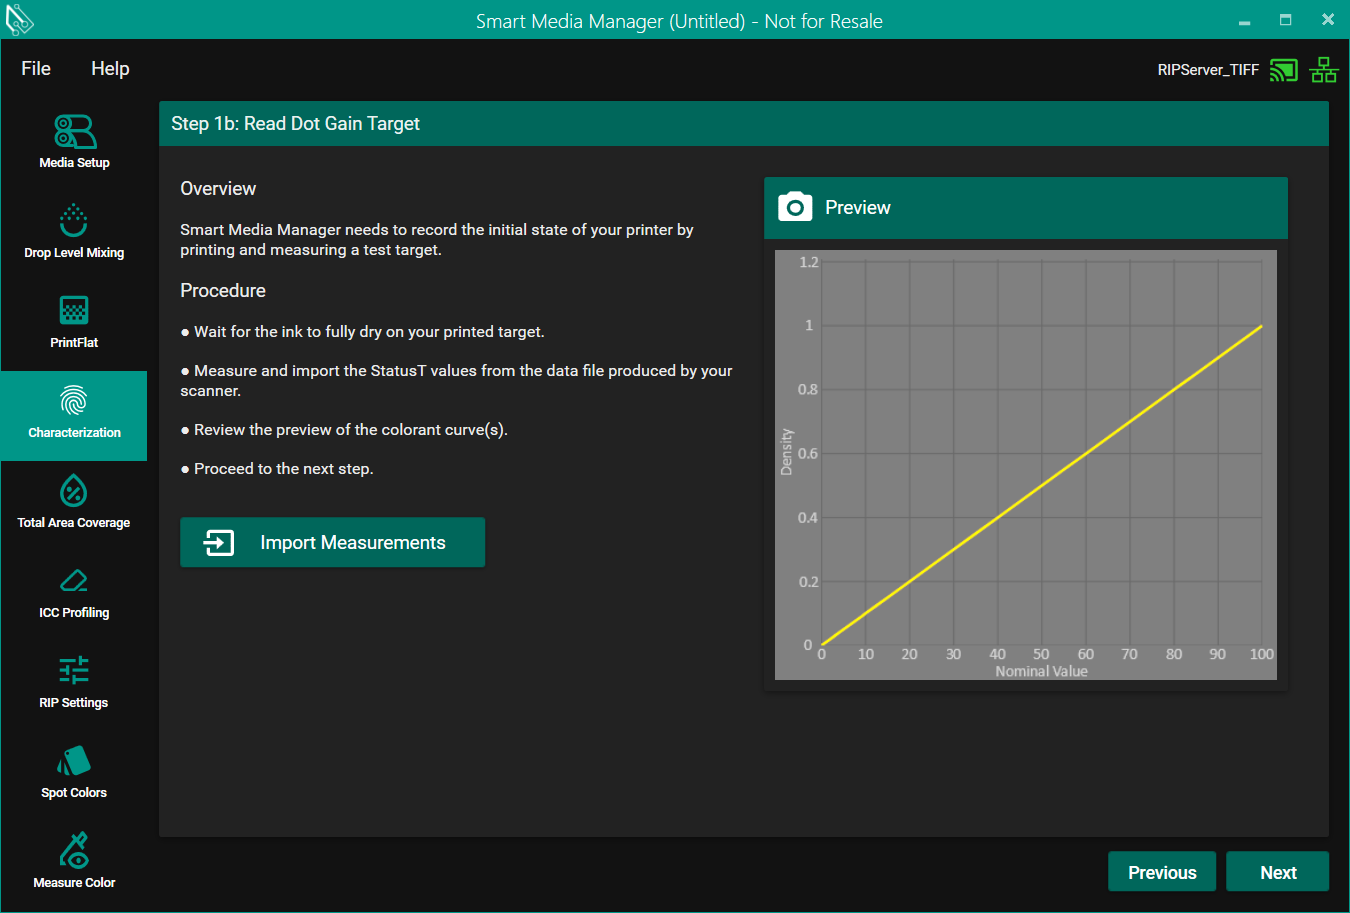
Step 1b: Read Dot Gain Target

When you first load step 3b, if you have no curve data this is what you will see, this is our default curve for all projects. This is a linear curve for every colorant.
Use IMPORT MEASUREMENTS to import the StatusT Density values from the data file produced by your measurement device. The Density is then plotted in the Preview graph to the right.
If you wish to continue with default values, choose Next to proceed.
